Internet Activities Monitored
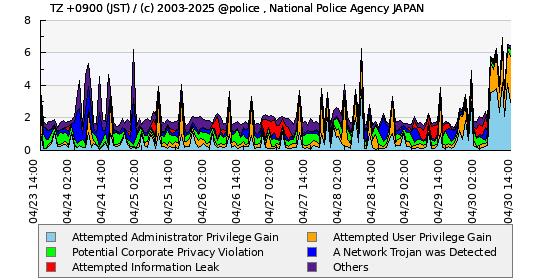
Signature based Intrusion Detection
The graph below portrays the number of malicious activities classified by method
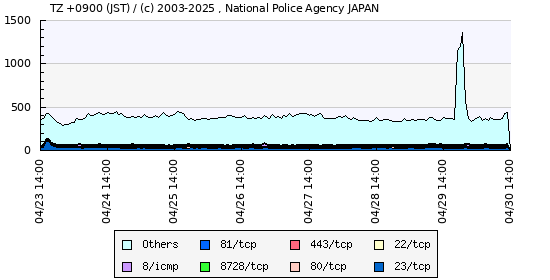
Access attempts against sensors
The graph below portrays the number of connection attempts classified by destination port
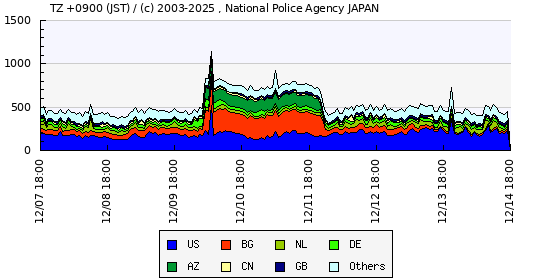
The graph below portrays the number of connection attempts classified by source country
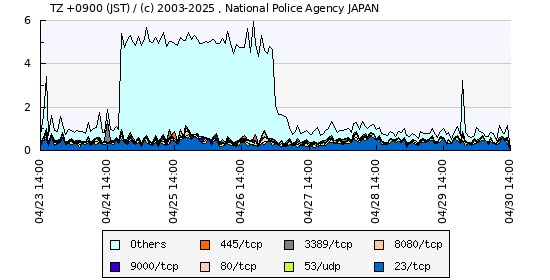
The graph below portrays the number of connection attempts classified by destination port(Japan)
These are the statistics of number of attacks and scans detected by sensors installed at Internet connection points of various Japanese police institutes.